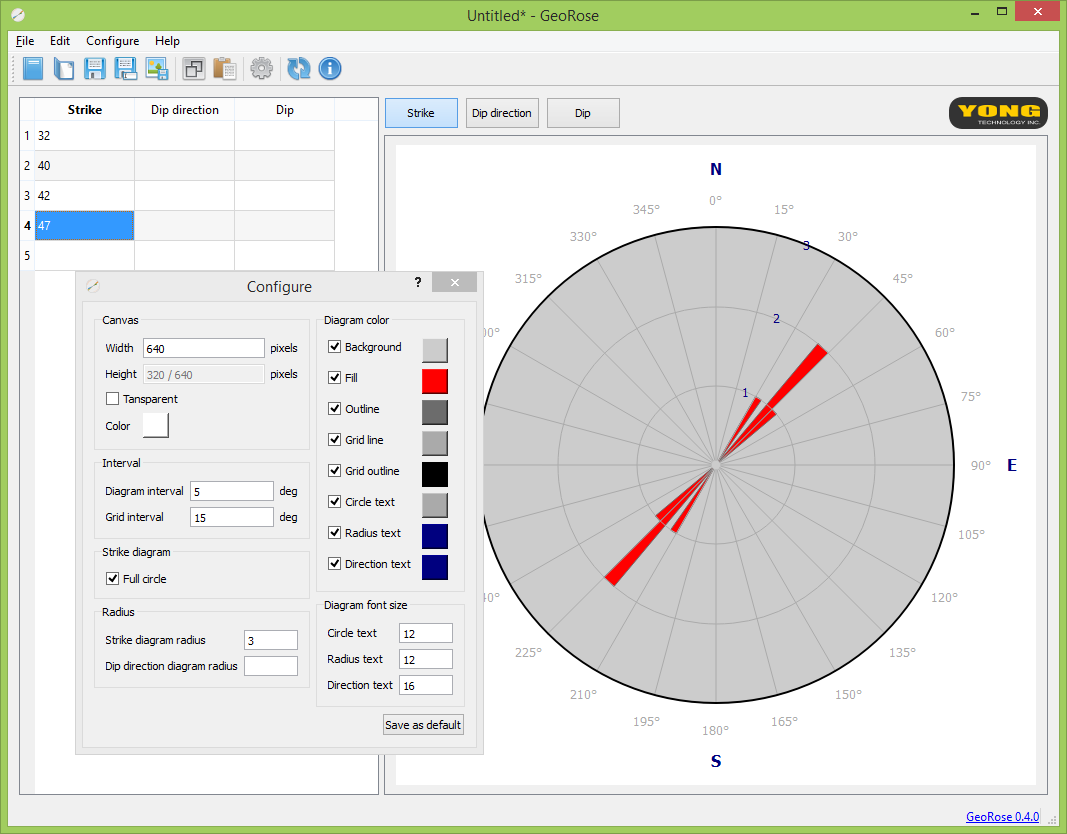
GeoRose is a rose diagram and stereonet plotting program, which can plot structural geology rose diagram, equal area and equal angle stereonet diagram.
Features:
- Generate strike, dip direction and dip rose diagrams, and equal area and equal angle stereonet diagrams.
- Export diagram in PNG, PDF, PS and SVG formats.
- Complete diagram displaying control.
- Support transparent background.
- Calculate strike from dip direction.
- Process both plane and lineation data
- Polar net grid for stereonet diagram
- Mouse coordinates tracking
- Copy data from and to spread sheet.
- Both Windows and Mac OS X versions available
- Version 0.4.3 provides polar area diagram / Nightingale plot
- It is FREE.
GeoRose 0.5.1 Installer 18.40 MB
GeoRose 0.4.3 Installer 5.83 MB
GeoRose 0.5.1 MacOS 11.32 MB
![]() |
![]() |
To cite GeoRose in publications, use
@Manual{,
title = {GeoRose},
author = {{Yong Technology Inc.}},
address = {Edmonton, Canada},
year = 2014,
url = {http://www.yongtechnology.com/download/georose}
}
Below is a short tutorial:
Can you assist or probably recommend a software that I can use to generate lineament map . Kind regards
Probably you can use some GIS program to get what you want.
thanks YONG ! for your georose free , i will go test it
Highly commendable, thanks for giving it free. However, Am stuggling with the file format to allow me have rose diagram saved.
Many thanks for this, very useful!
May I suggest an option to suppress the gridlines to the background?
(they currently are in front of the depicted data)
Good idea. Will update in the next version.
Very nice software! It even automatically convert my data t suit the plotting needs.
Thanks a lot!
How do you plot unidirectional data, such as younging directions on GeoRose?
what does strike mean?
Is not a valid Win32 application error. on running. Would do well to indicate what versions of Windows this isn’t suitable for rather than just list “Windows”
It should run on both 32-bit and 64-bit Windows.
Brilliant, easy to use FREE software for creating simple rose diagrams that look great.
Well done!
is it possible to get the data plotted as a percentage instead of a number?
Thanks!
I will add this function to it.
Hello
Is this program compatible with Mac? I just get an error message saying no application can open the file
The Mac version is not released yet.
Please take a look the newly released version for Mac.
The software was very easy to understand and intuitive to use – thank you!
I would like to recommend it to my students and colleagues 🙂
It awesome!!! thank yong..this software help me a lot..May God bless u!!
Amazing Software. Does the job quite easily.
Excellent!!!!
how do i use it. i mean guide to use on how to enter and visualize my data
Joshua,
If you install GeoRose properly, open it and type your data in or copy your data from spreadsheet and paste it to the left side table. The diagram should show up once there is data feeding.
You can switch drawing modes by clicking the three buttons above the drawing canvas.
To change the appearance of the diagram, you will have to configure it by using configure dialog, which can be found in configure menu.