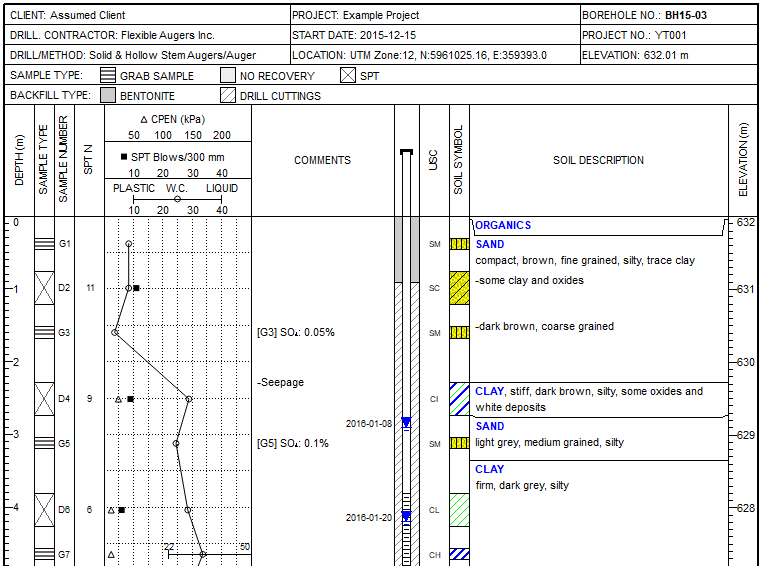
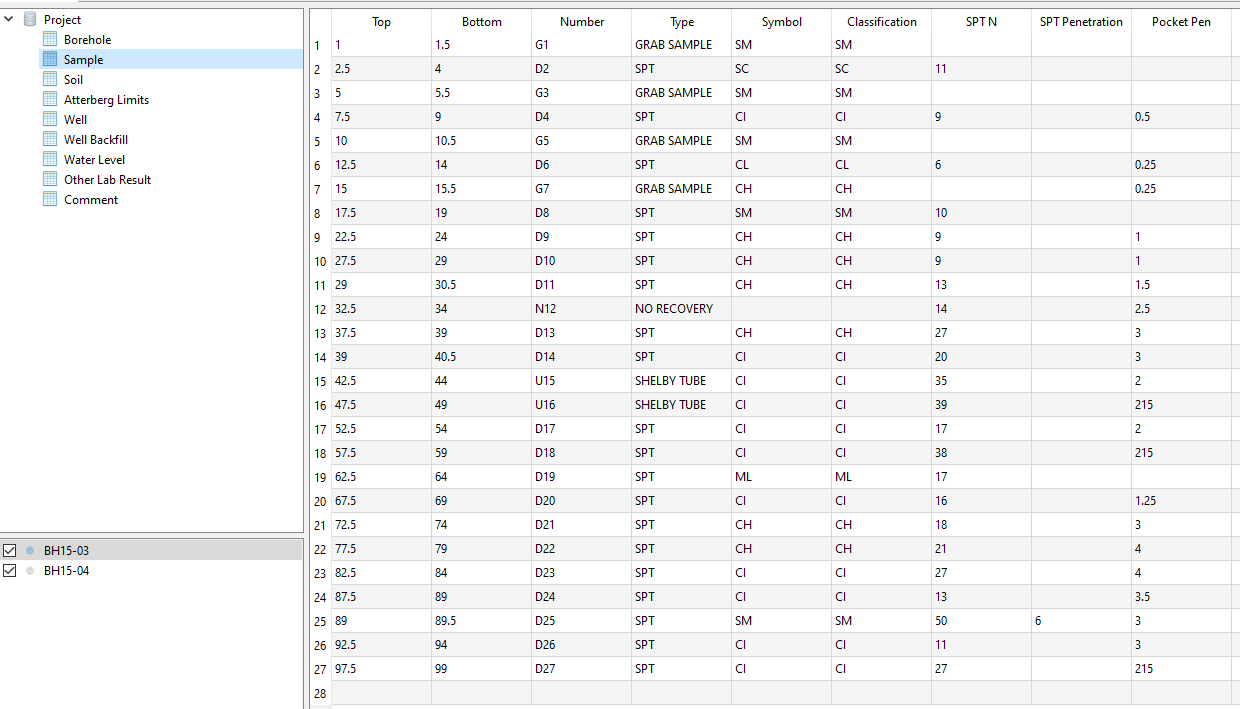
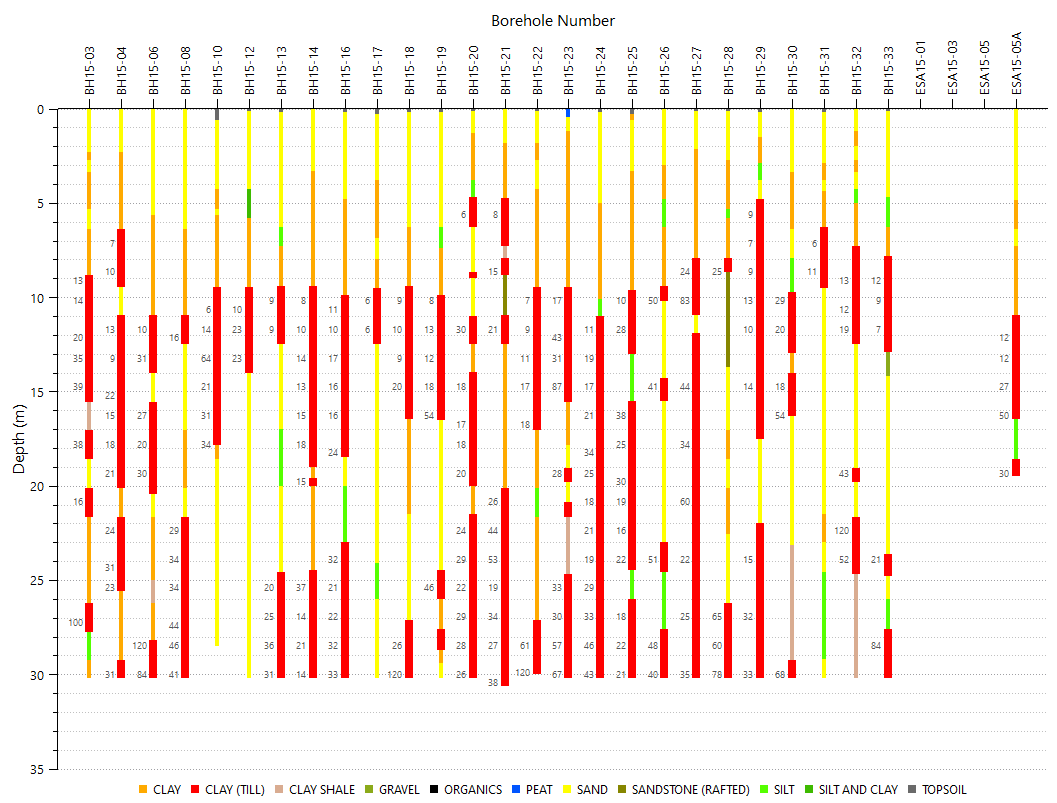
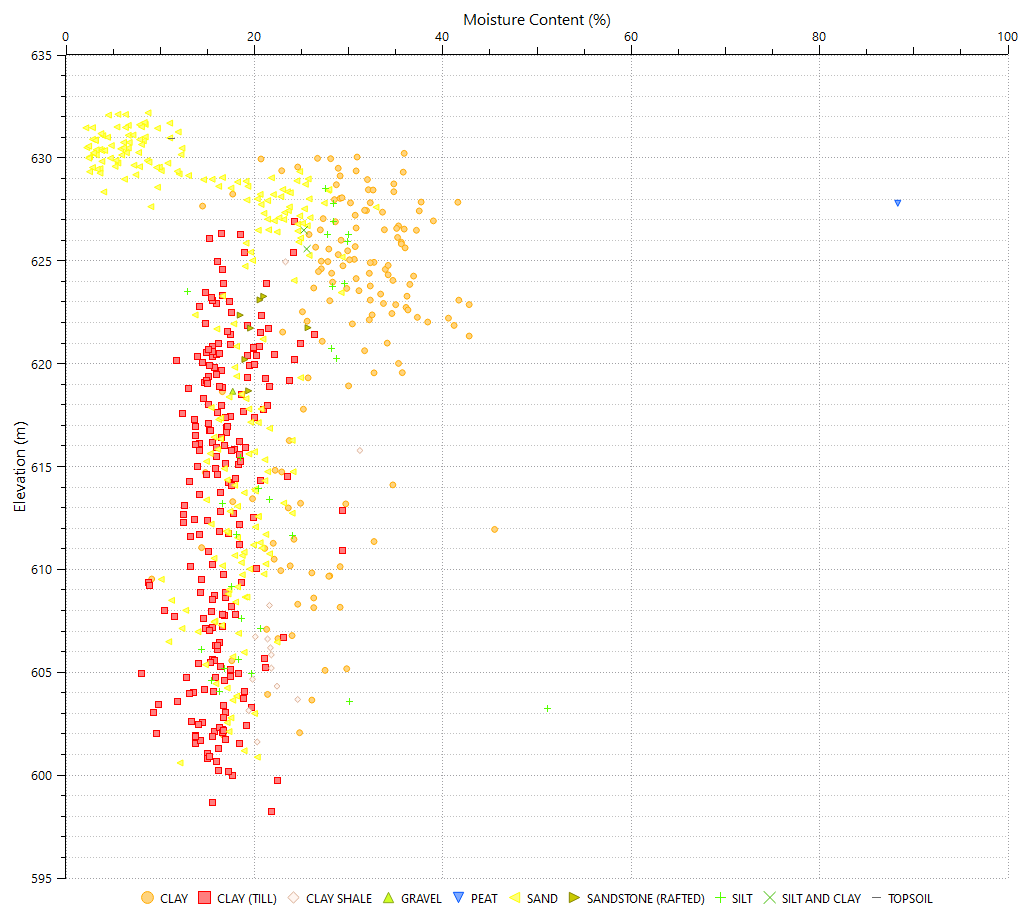
SoilStats is a software program designed for engineers to generate geotechnical, geological, environmental, and oil and gas well borehole logs,summarize and visualize borehole data, visualize ground surface data and other general objects.
The database and borehole log templates of SoilStats are fully customizable to meet any requirements. SQLite database is used to store borehole data and Python is used to generate borehole log and visualization template, and provide related data. Since Python is used for the log templates, the templates can be designed with extremely high flexibility and complexity. Many types of logs and different languages can be implemented in one template.
Existing borehole data (Excel files, gINT files, etc.), as long as they are able to be read with Python directly or indirectly, can be imported to generate borehole logs or visualize the data with SoilStats.
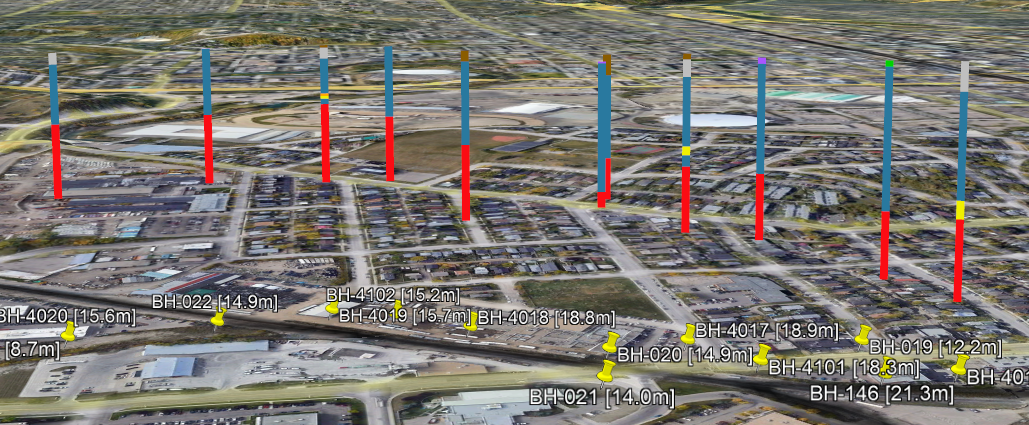
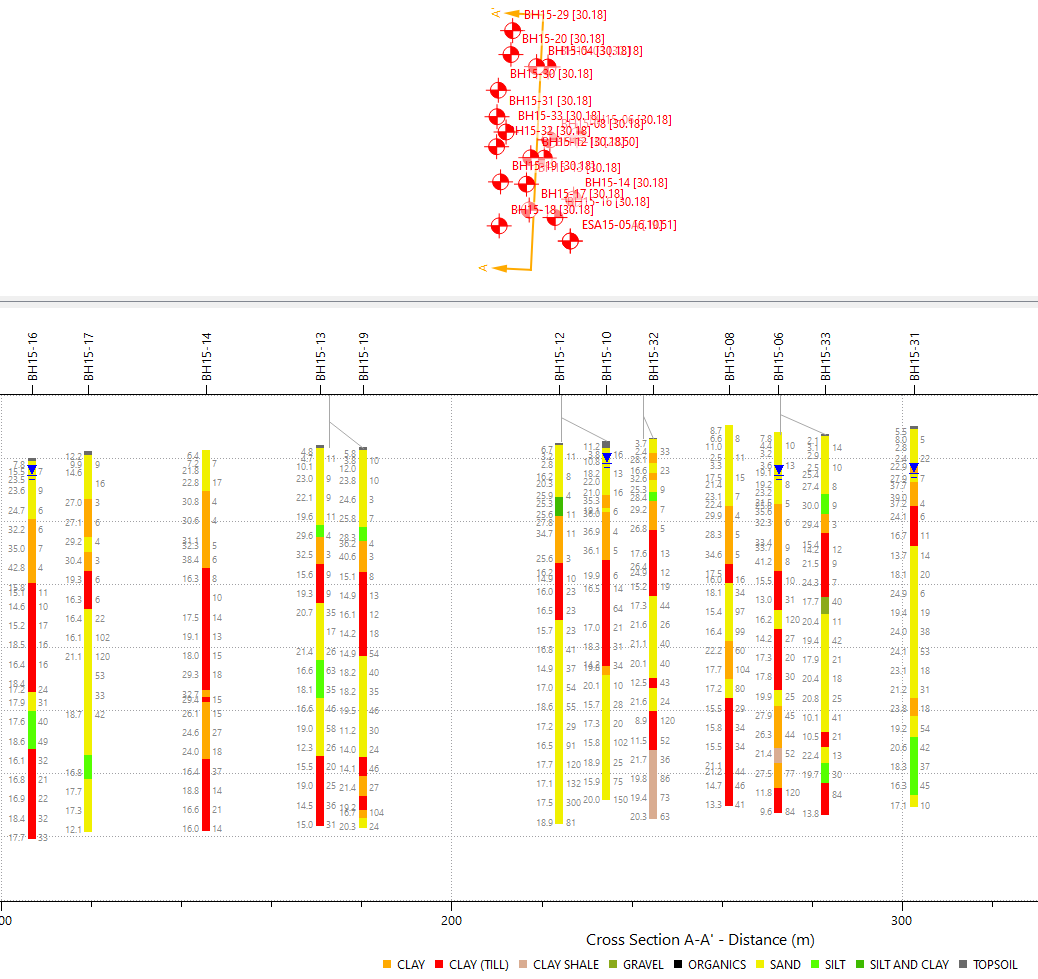
Borehole locations, associated borehole information, and soil stick logs can be exported as kmz files and visualized with Google Earth. Boreholes and cross-sections can be exported in dxf format.
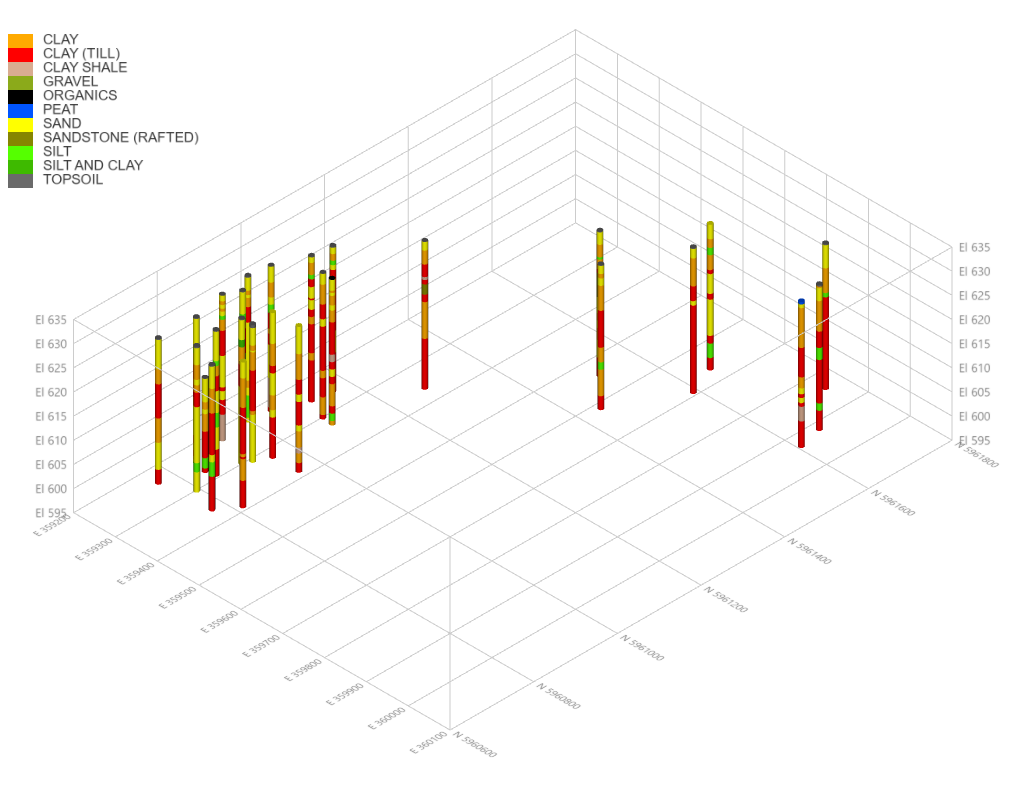
Three dimensional ground surface data (*.xyz) can be easily imported to construct ground surfaces. Users can also construct three dimensional geometries and show them by construction steps.
If you are familiar with Python and SQLite, you are more than welcome to create your own datamap file and other templates. In the program folder, there is an example project and an default template, which should be able to provide you with some basics about how to customize the program for your projects.