SoilStats is a borehole log software program tailored for geotechnical, environmental, geological, and energy sector applications. It provides robust tools to generate borehole logs, summarize borehole data and visualize both subsurface information and ground surface data in 3D.
Key Features and Capabilities:
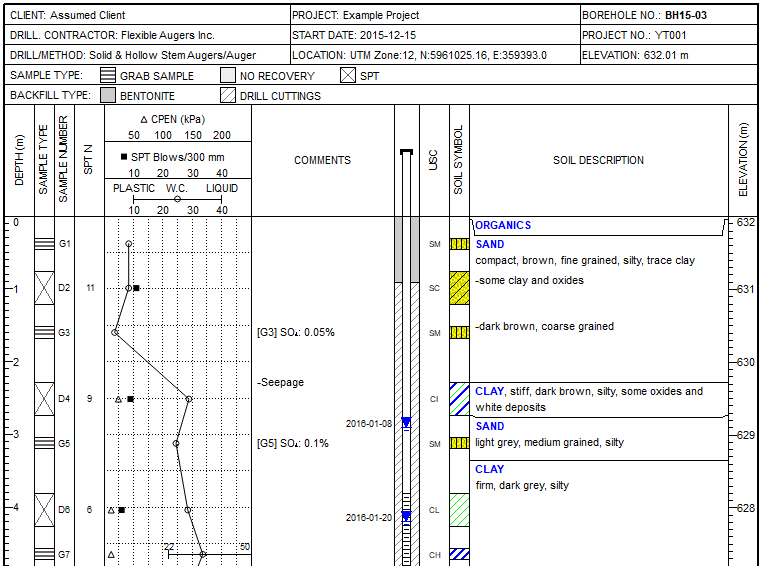
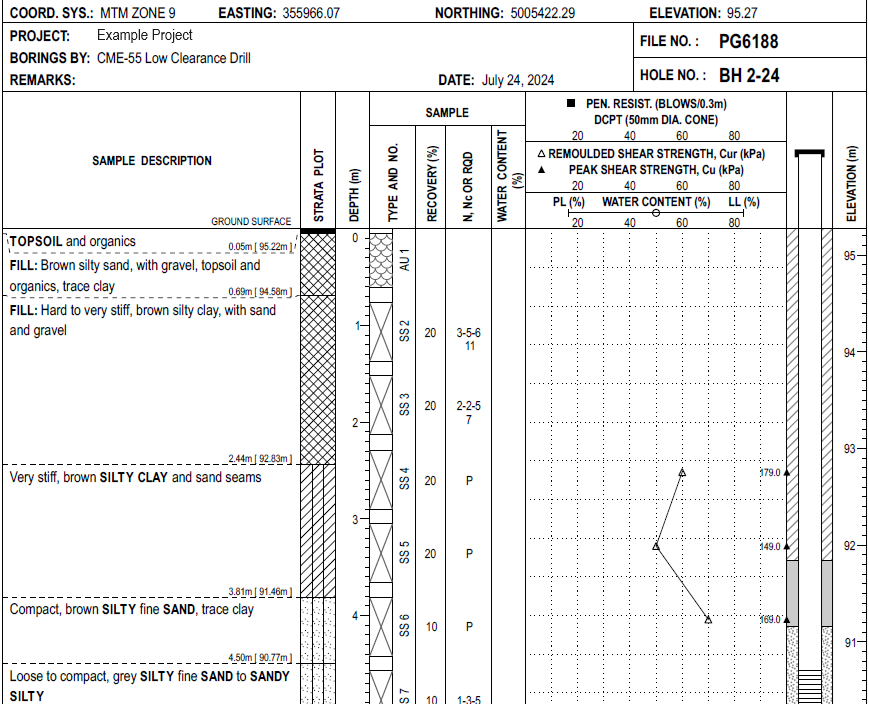
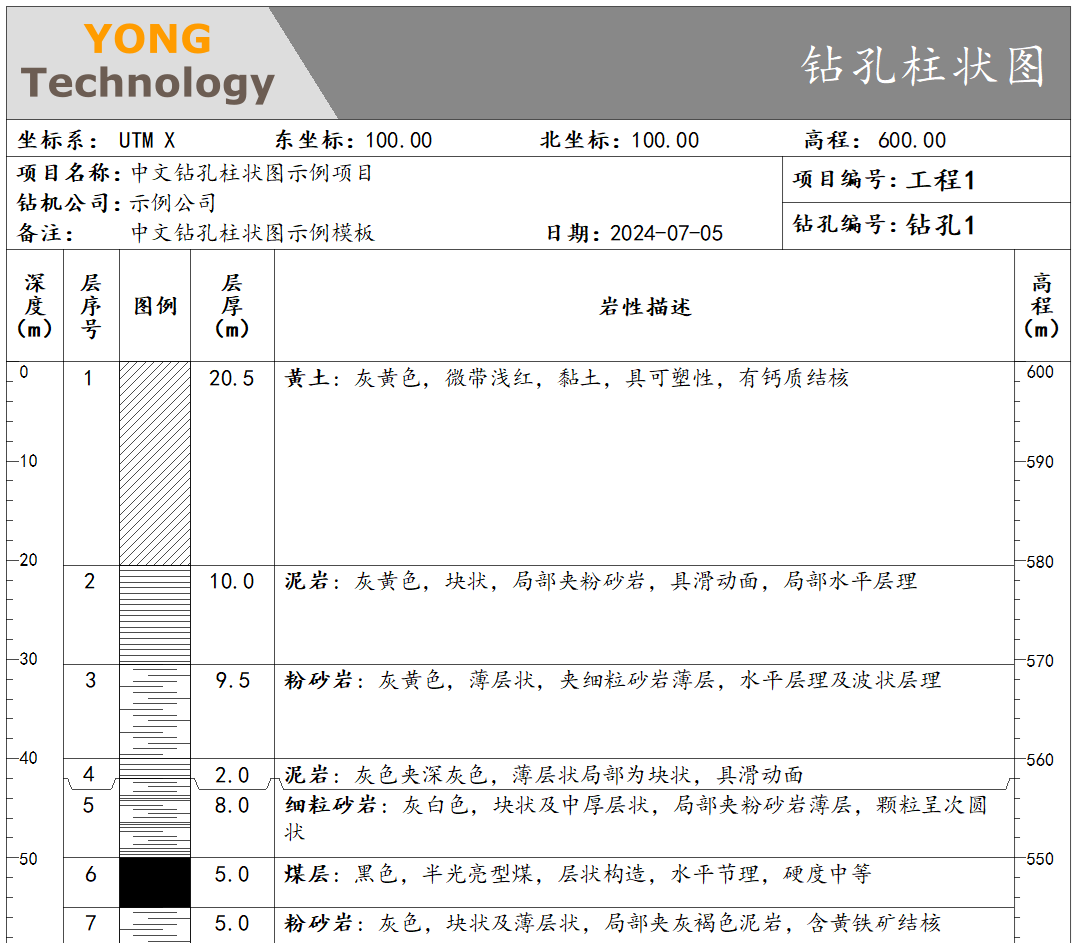
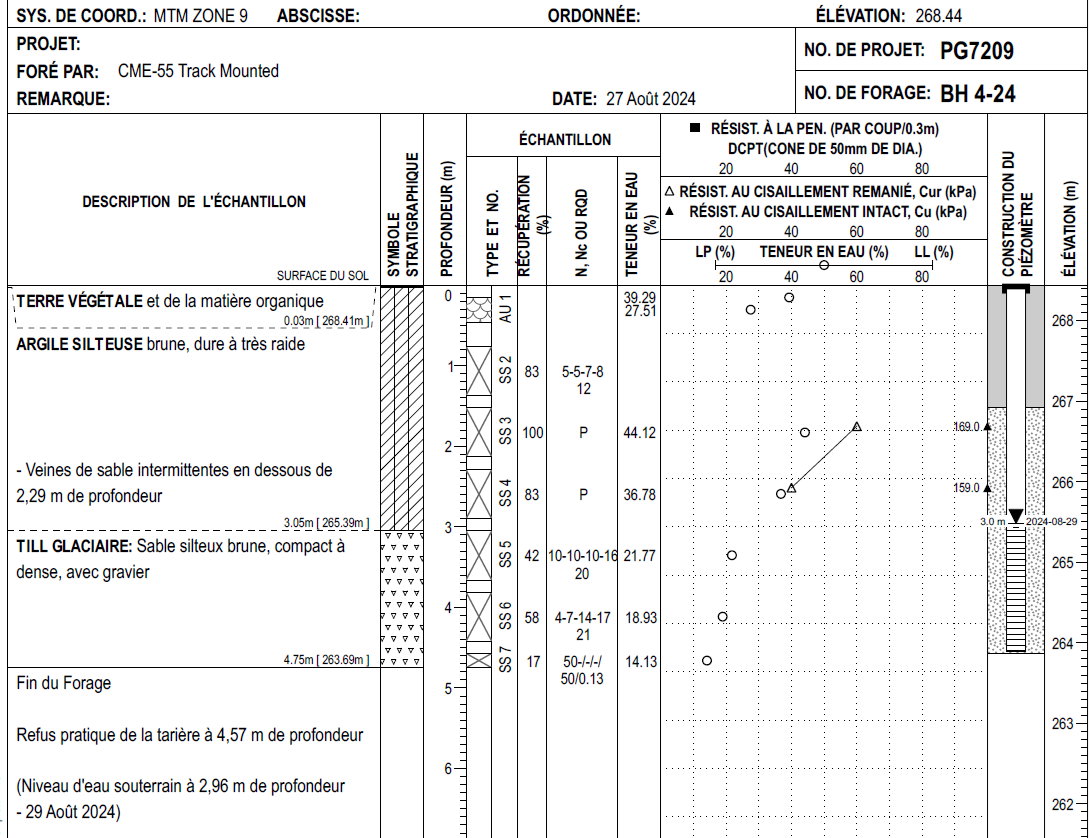
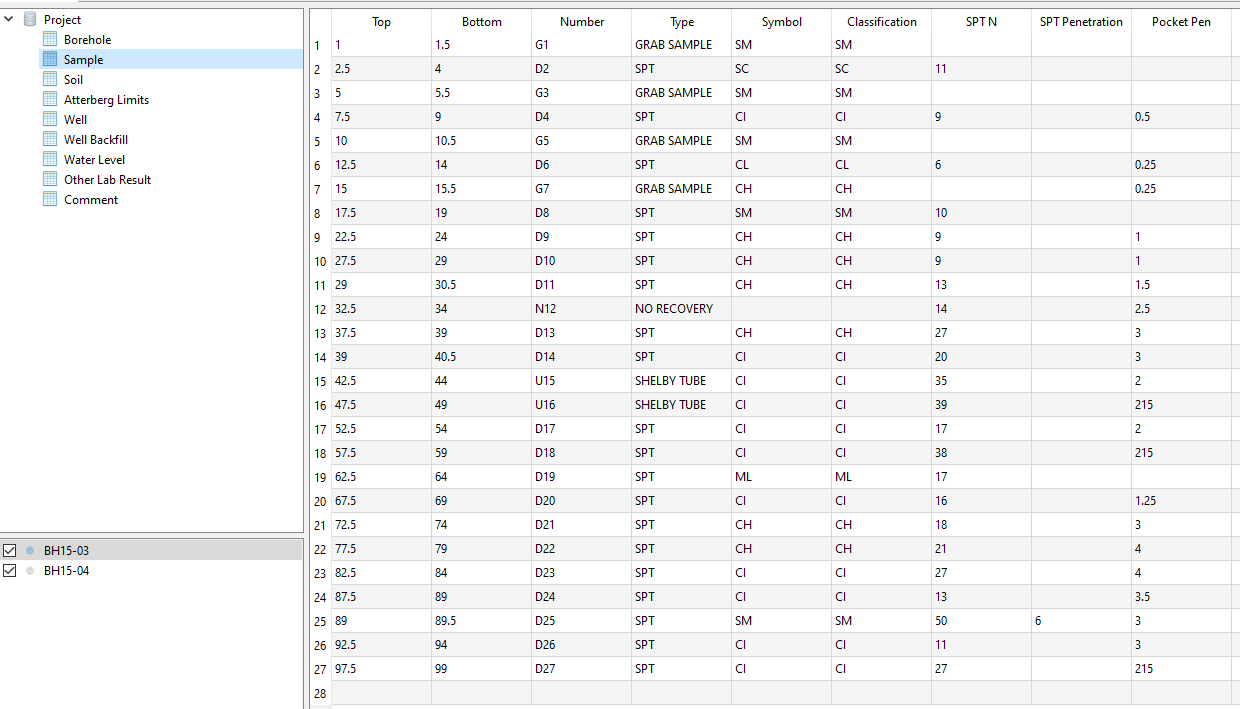
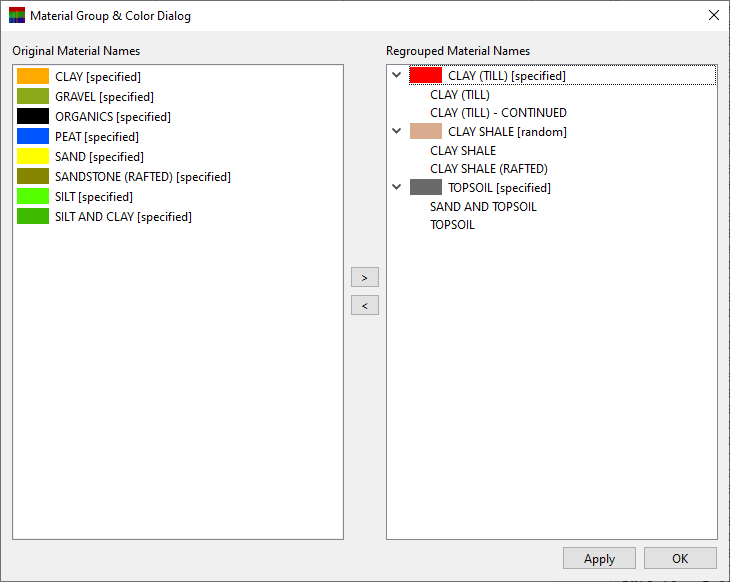
Highly Customizable Templates: The software utilizes a fully customizable database and template system to meet diverse project requirements. By using SQLite for data storage and Python for log generation, highly complex and flexible templates can be created to support various log types and languages.
Extensive Data Integration: SoilStats can import existing data from sources such as Excel, gINT, CSV, XML, JSON, and any other sources readable via Python.
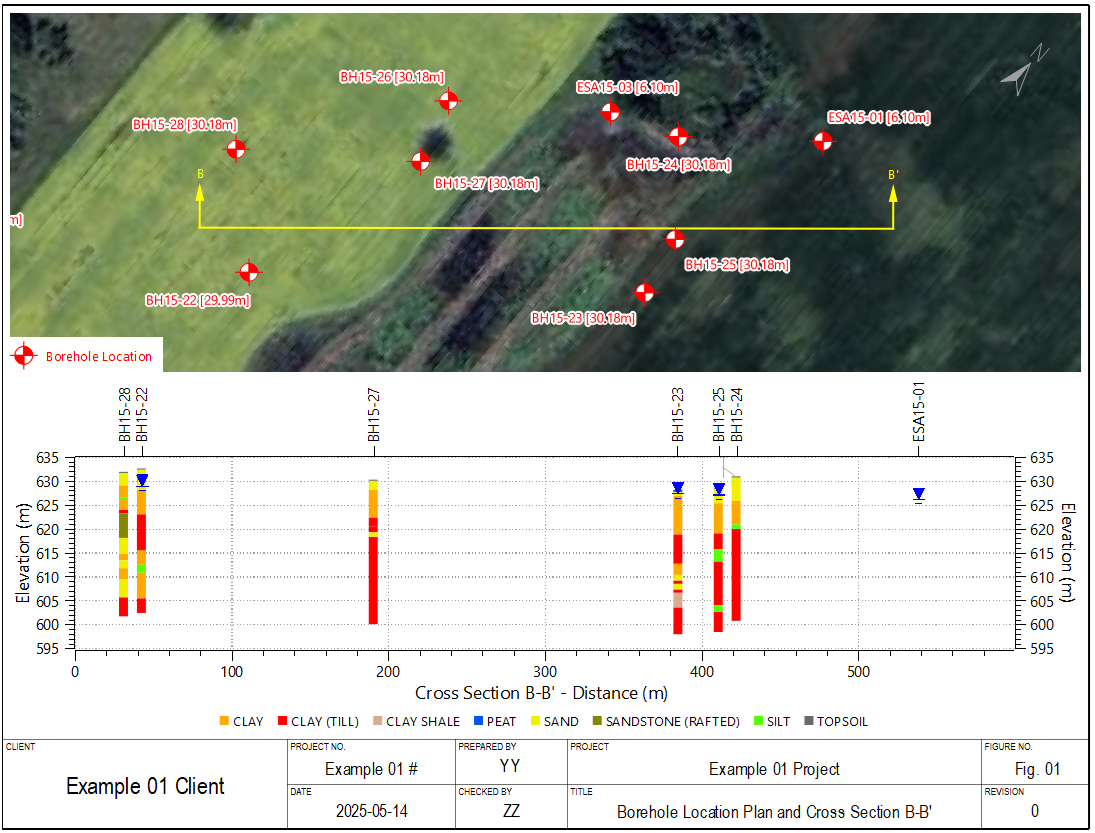
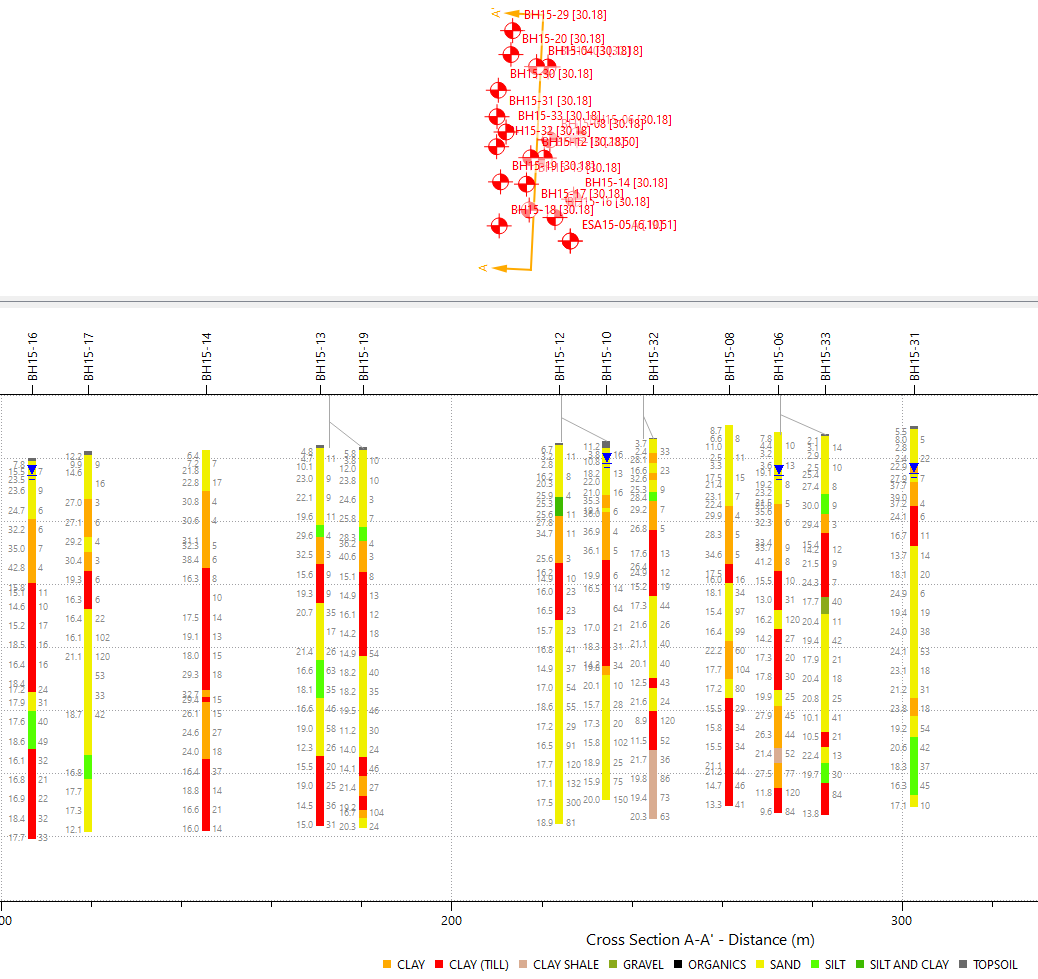
Report Readiness: Plan views and cross-sections are easily organized within paper space for seamless integration into professional reports.
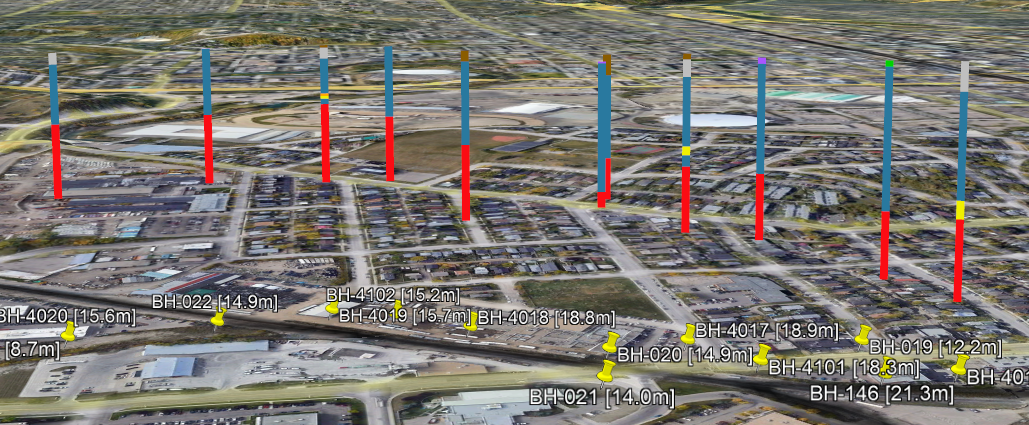
Advanced Export Options: Users can export borehole locations, metadata, and soil stick logs as KMZ files for viewing in Google Earth, or export boreholes and cross-sections in DXF format for CAD integration.
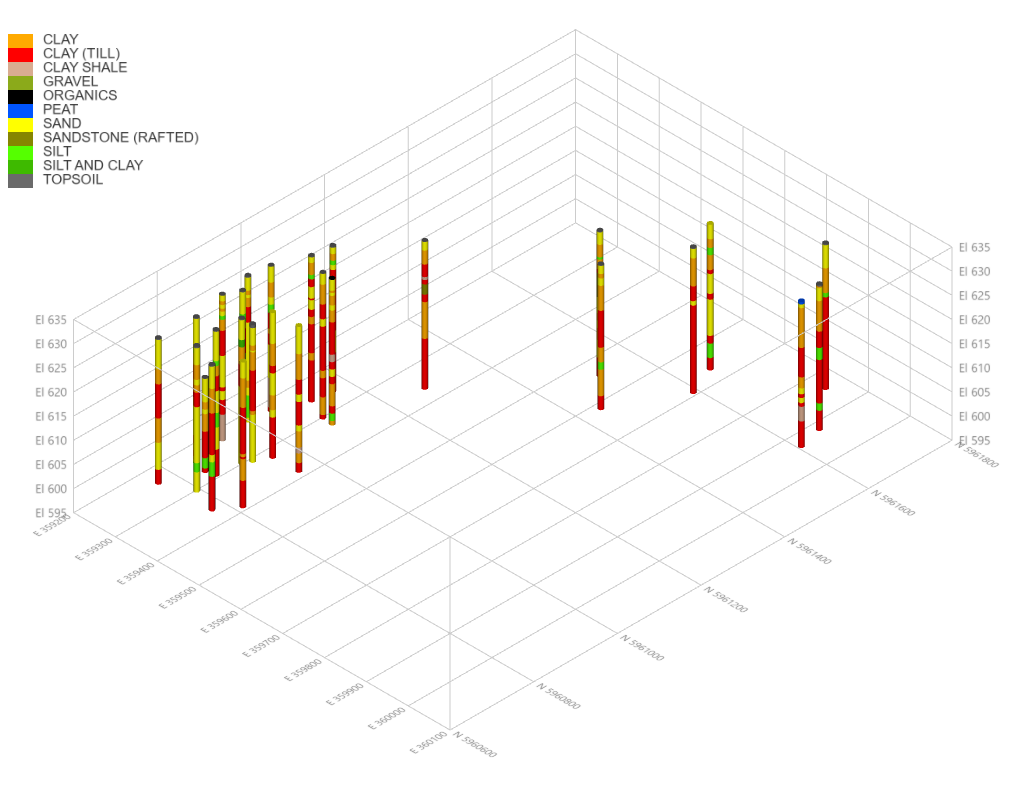
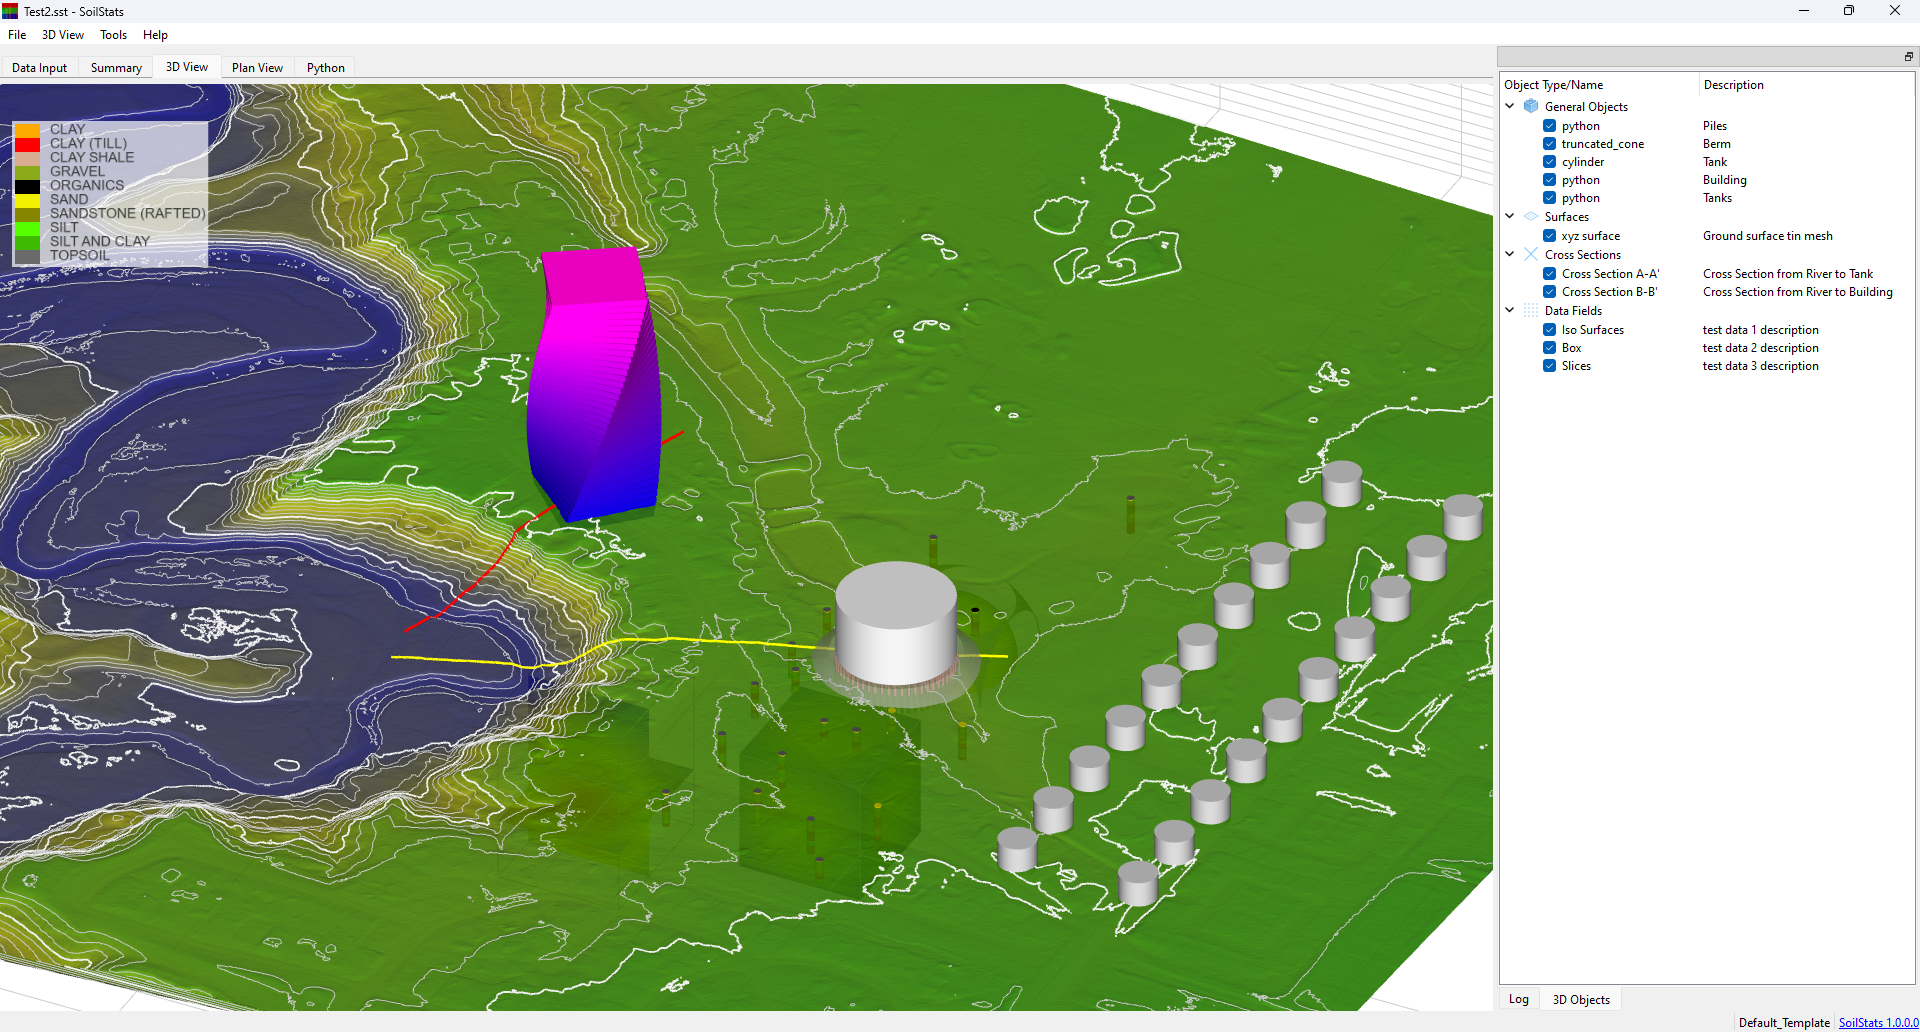
3D Surface and Geometry Construction: The software allows for the easy import of 3D ground surface data (XYZ files) and the creation of custom 3D geometries, which can be displayed according to specific construction steps.
Global Accessibility: The user interface currently supports a wide range of international languages, including Arabic, Bengali, Chinese, English, French, German, Hebrew, Hindi, Indonesia, Italian, Japanese, Korean, Polish, Portuguese, Russian, Spanish, Thai, Turkish, Ukrainian, and Vietnamese.