SlopeMonitor

SlopeMonitor is a data management, data processing and visualization software program specifically engineered for geotechnical slope monitoring programs. By leveraging a centralized database architecture, SlopeMonitor streamlines the organization of a large number of projects, borehole datasets, and diverse instrumentation data into a single, intuitive interface.

Geospatial Mapping

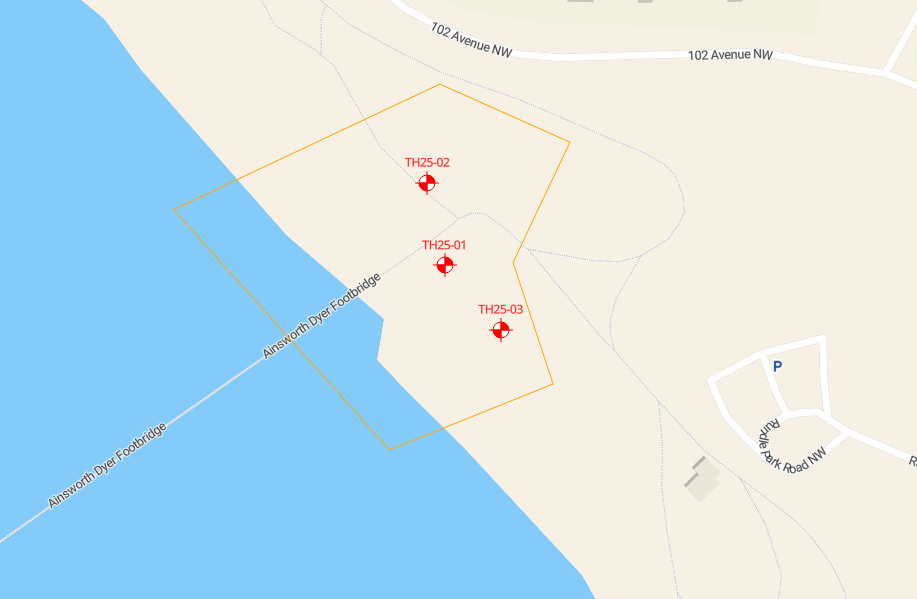
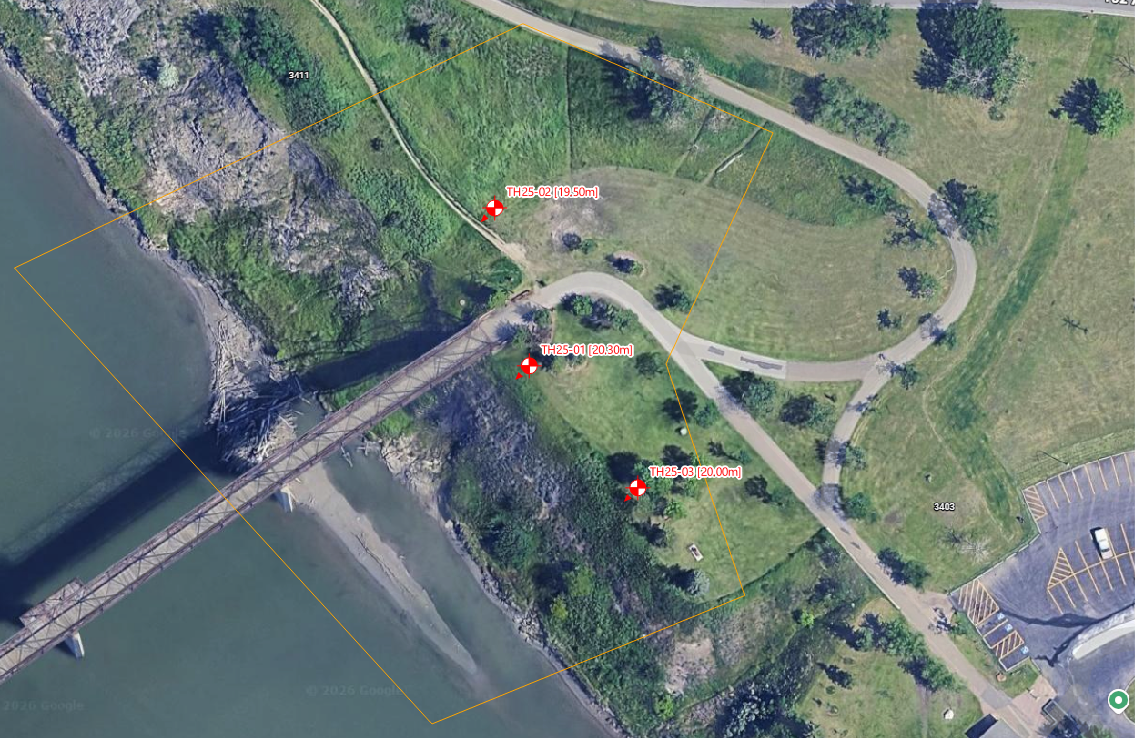
SlopeMonitor features an integrated mapping system that provides immediate spatial context for project sites and borehole locations. This allows engineers and project managers to navigate large-scale monitoring programs with speed and precision.

Advanced Data Integration & Processing

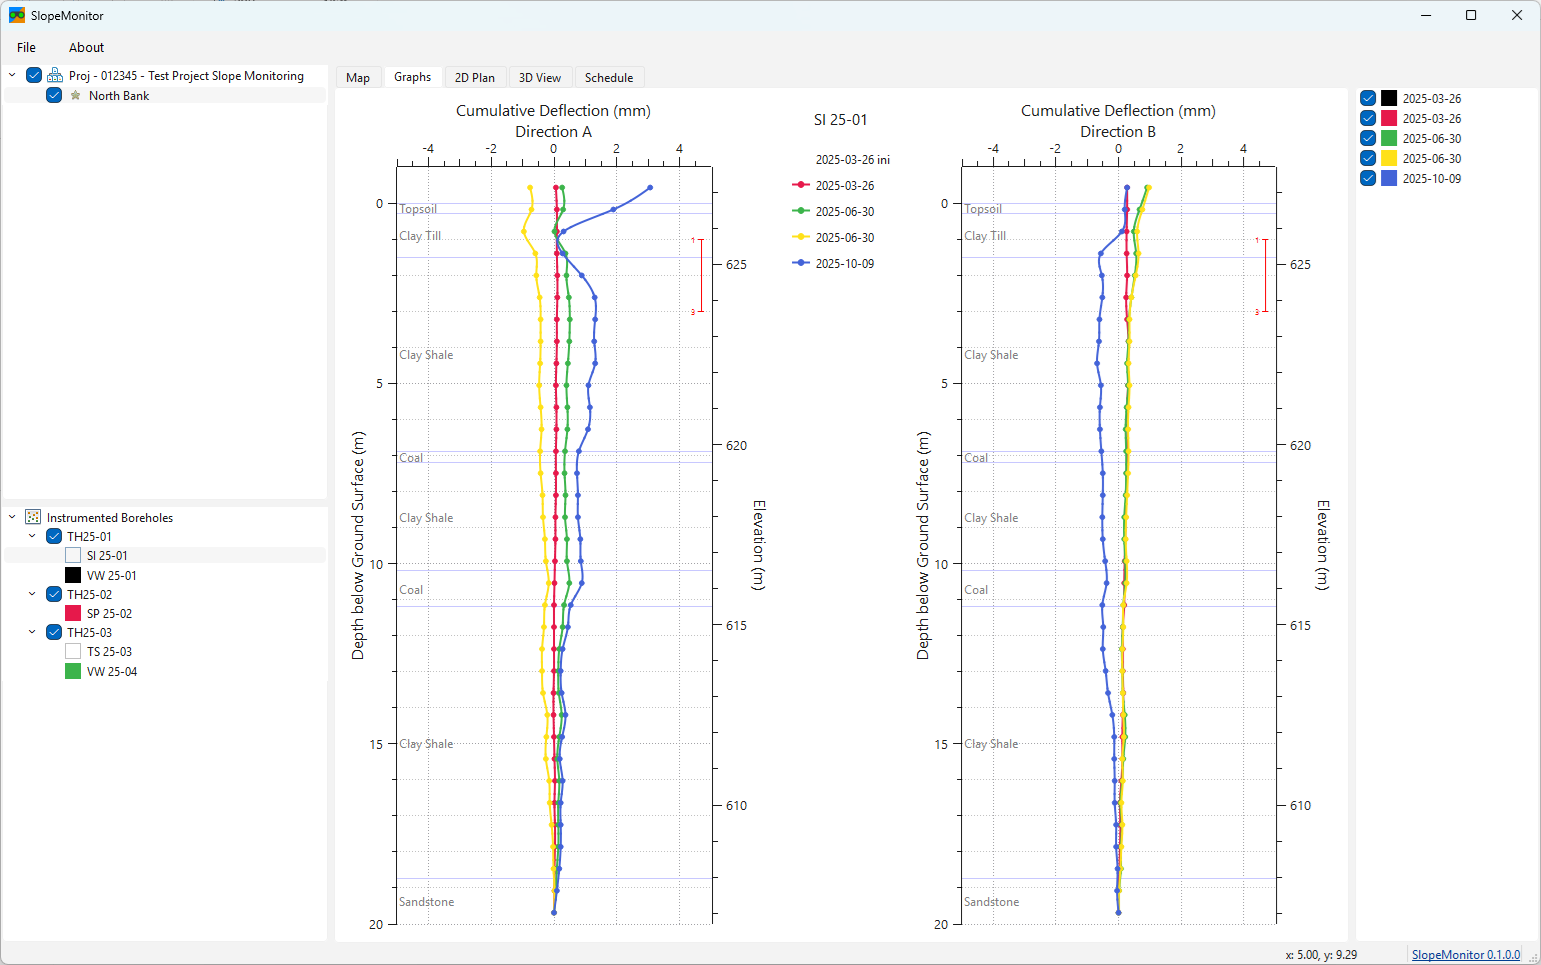
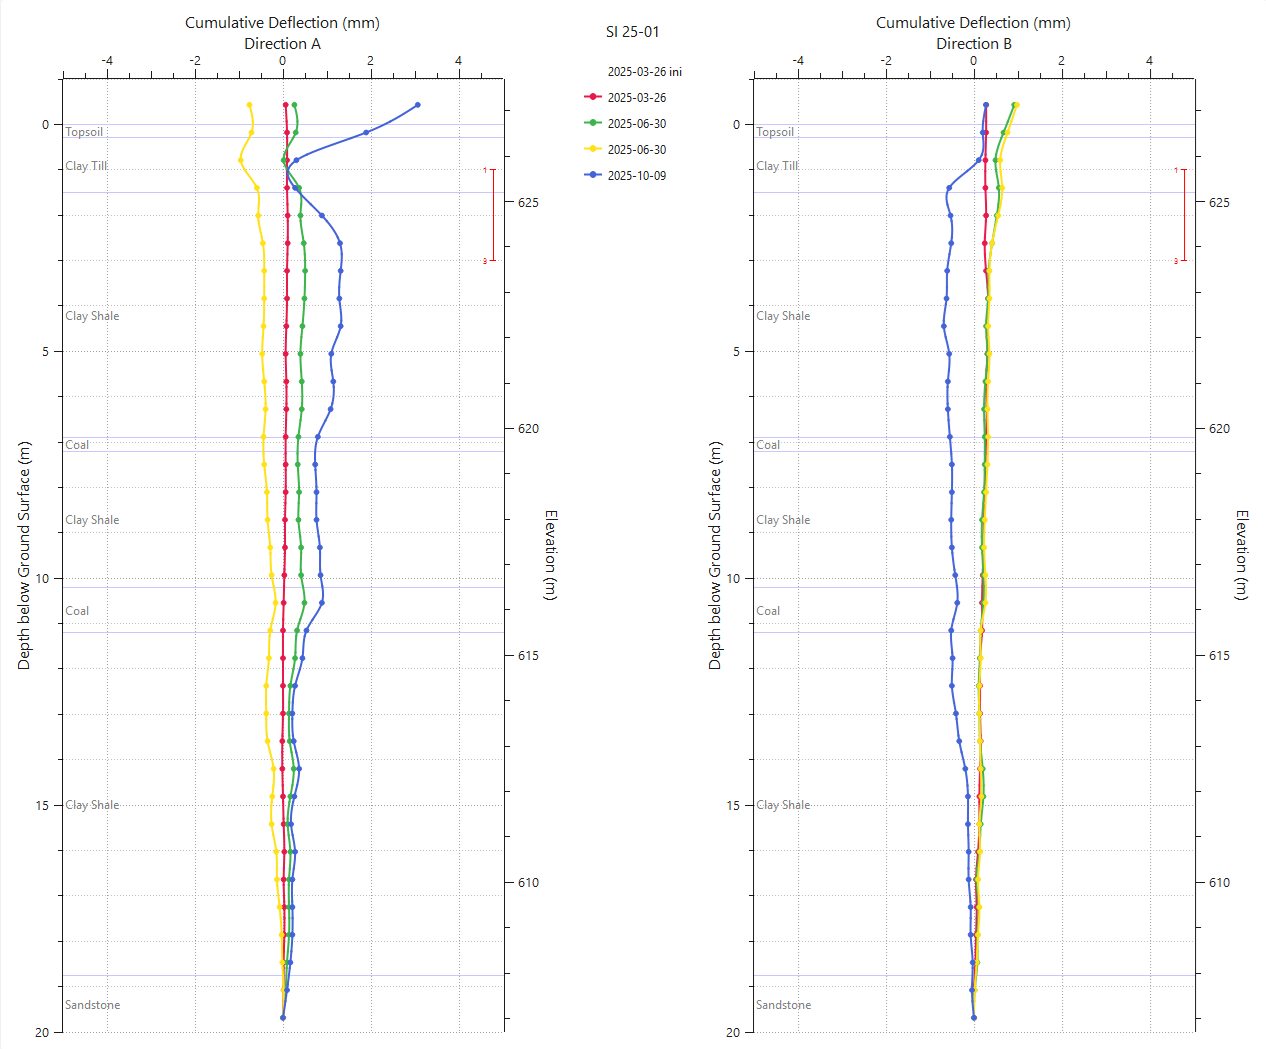
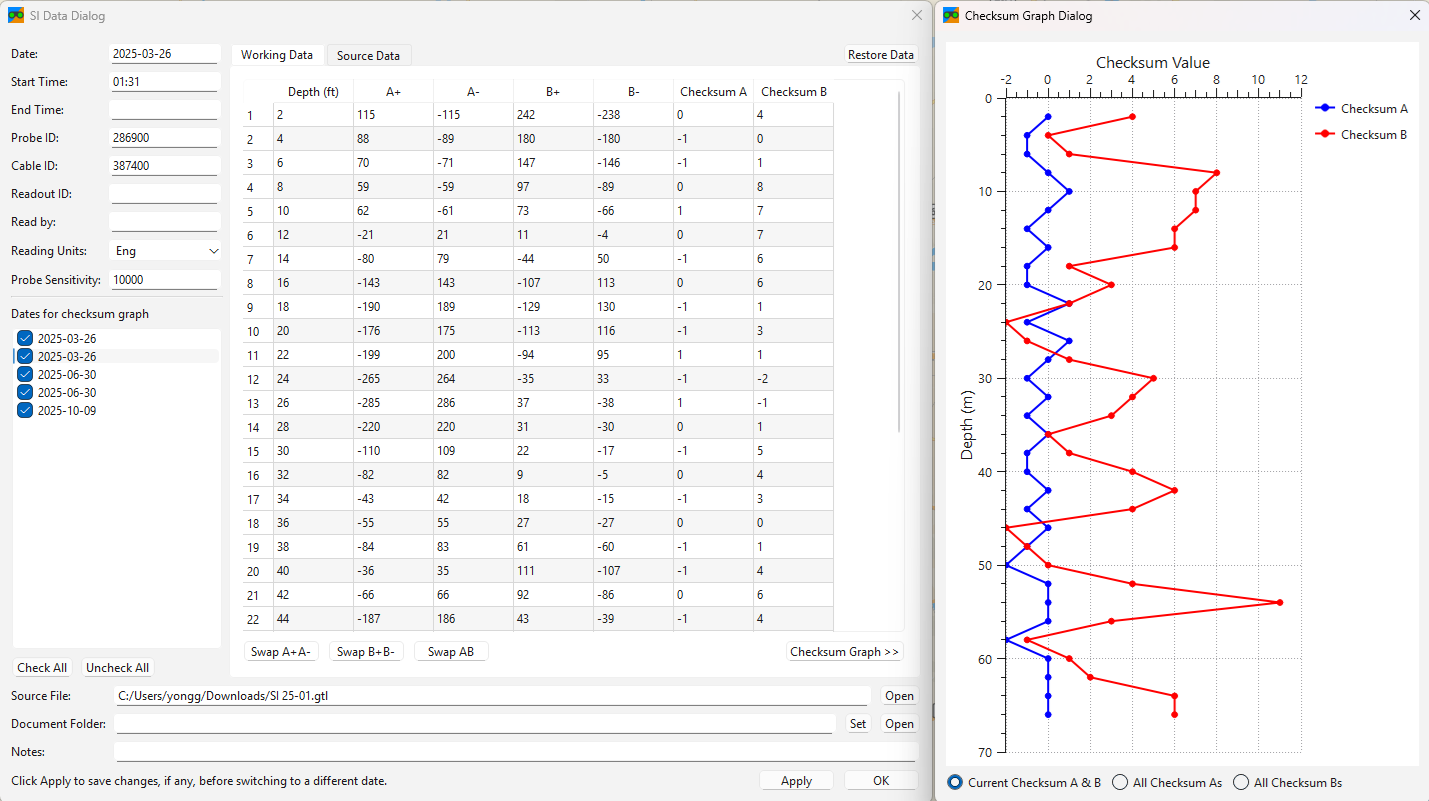
The software supports seamless importing and processing for industry-standard inclinometer data, including GTilt data, and data from RST Instruments, GEOKON, and Encardio Rite.

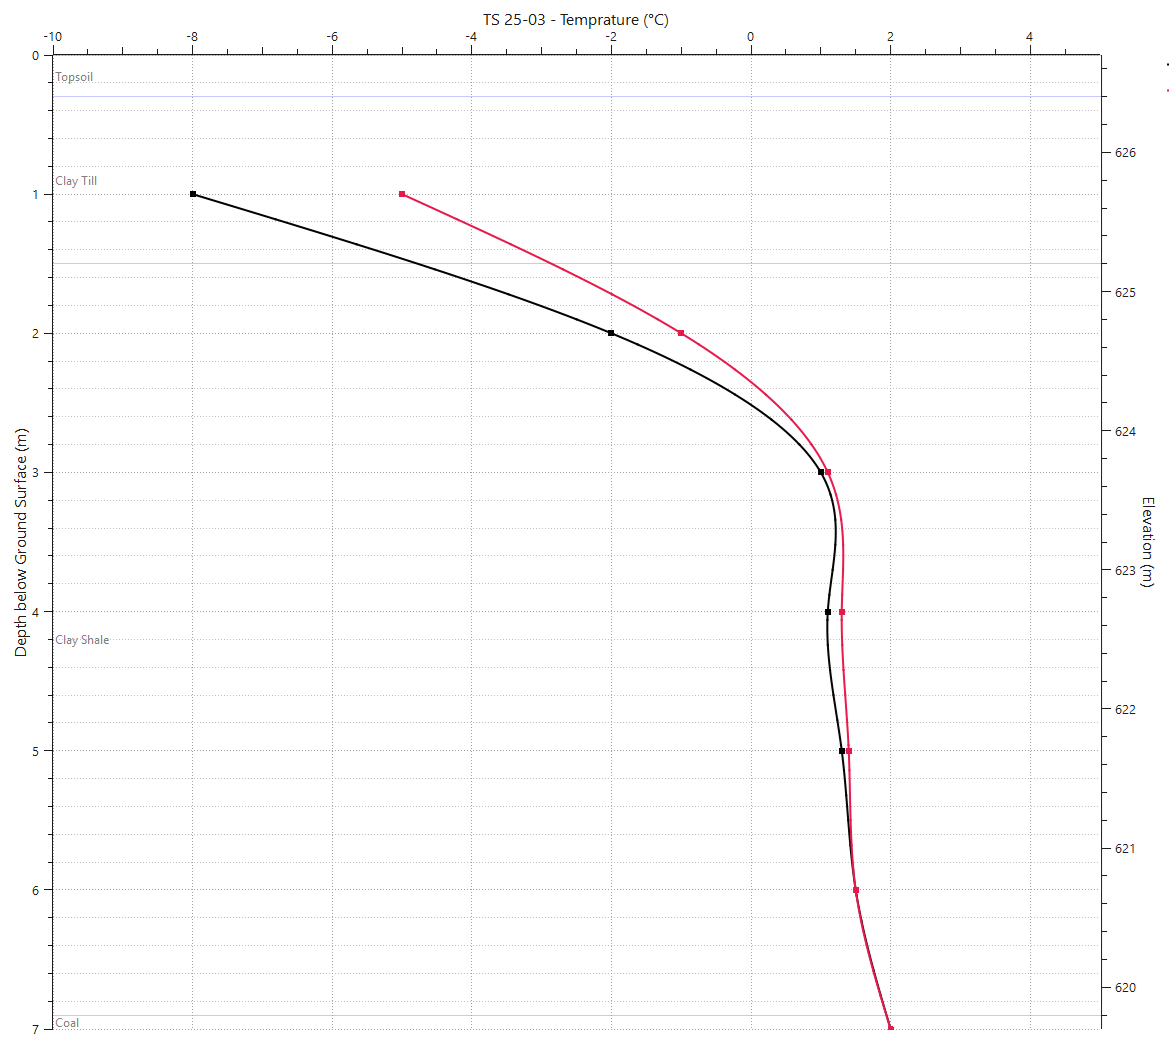
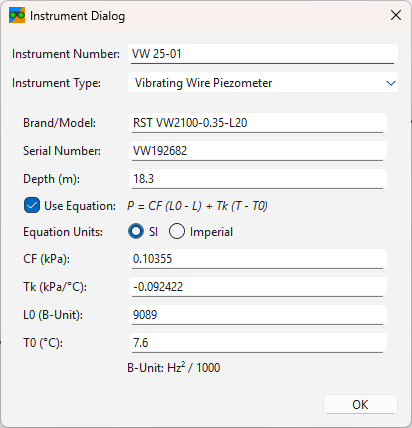
For other data formats, SlopeMonitor’s extensible architecture allows for custom Python-based import modules, ensuring compatibility with any data source. Beyond inclinometers, the system can process and graph readings for groundwater levels (vibrating wire piezometer readings and standpipe readings) and thermistor strings.

Multi-Dimensional Visualization

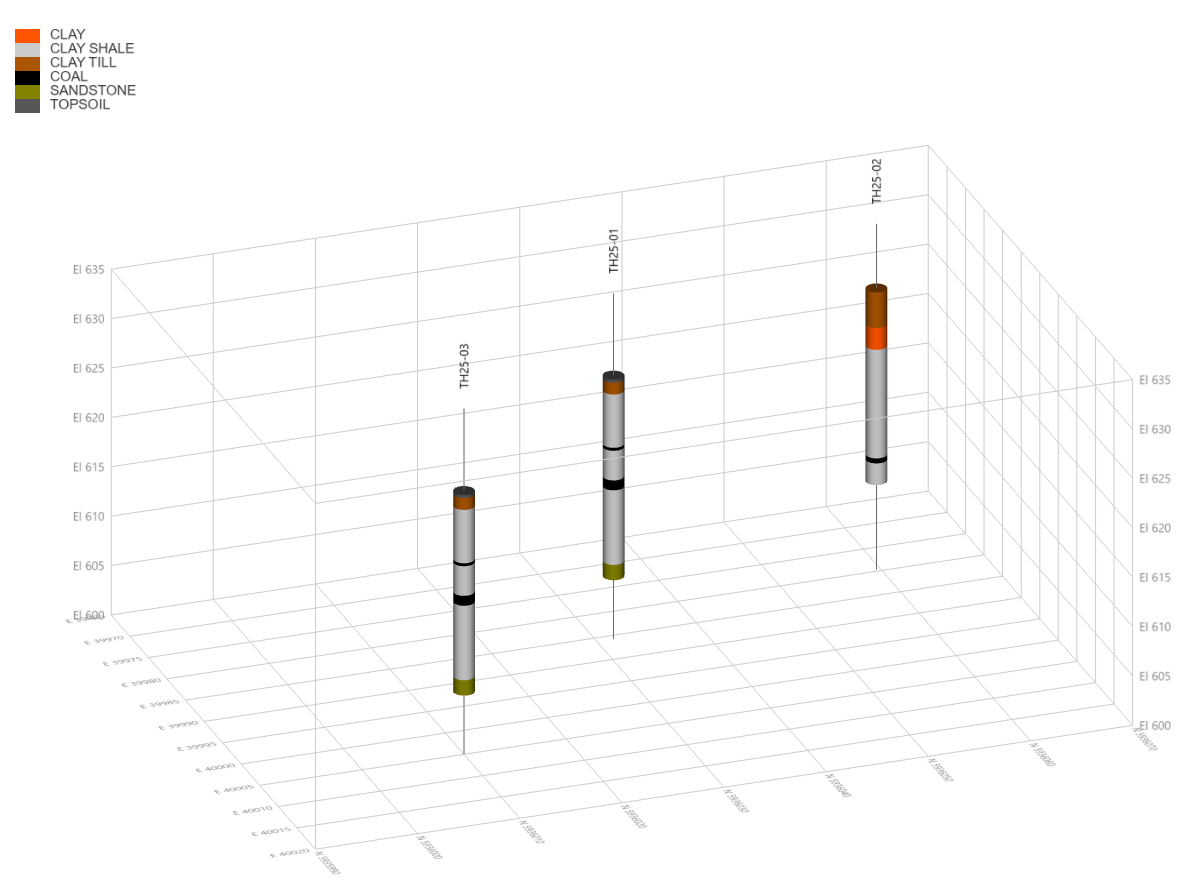
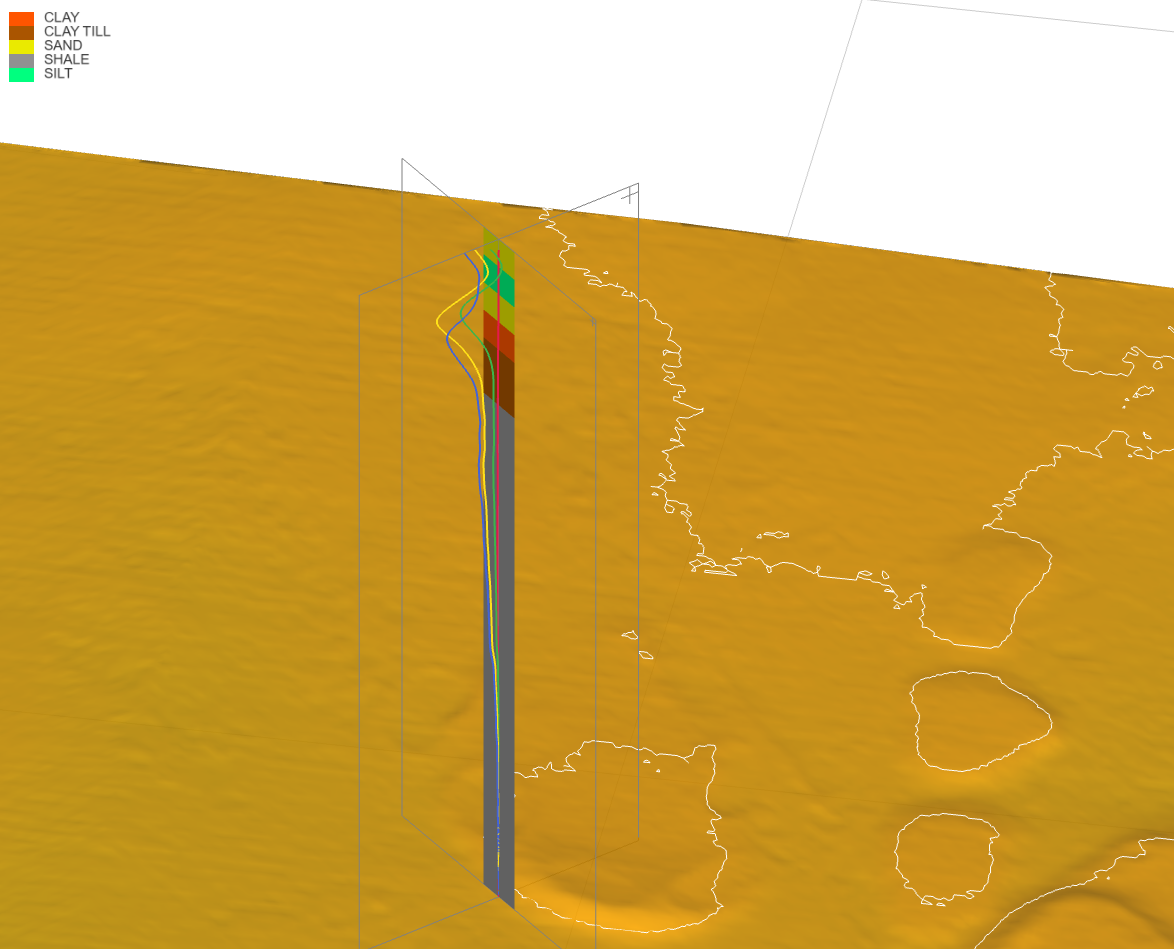
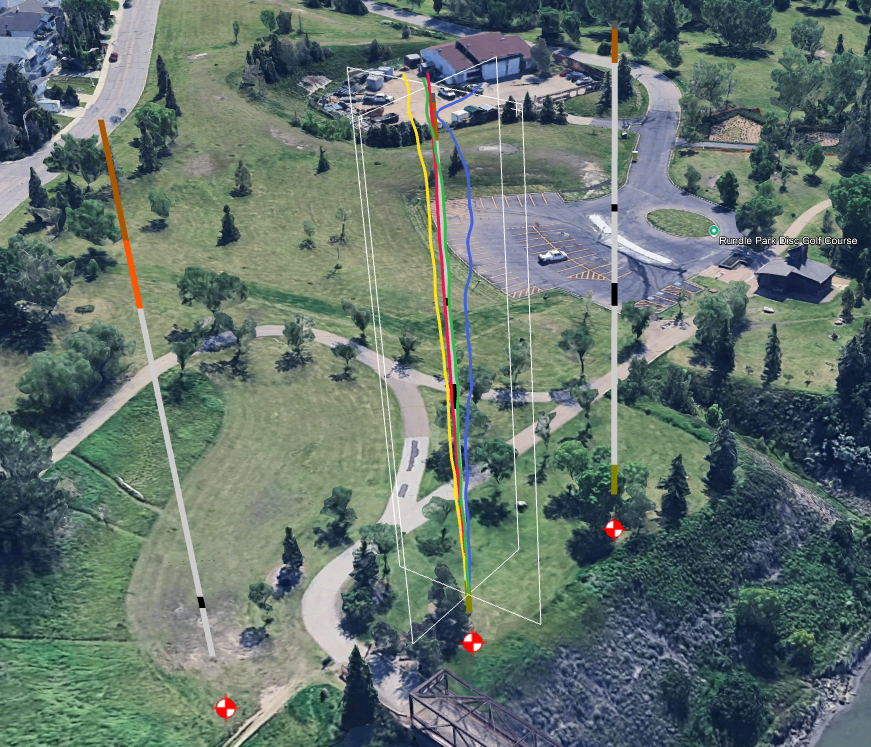
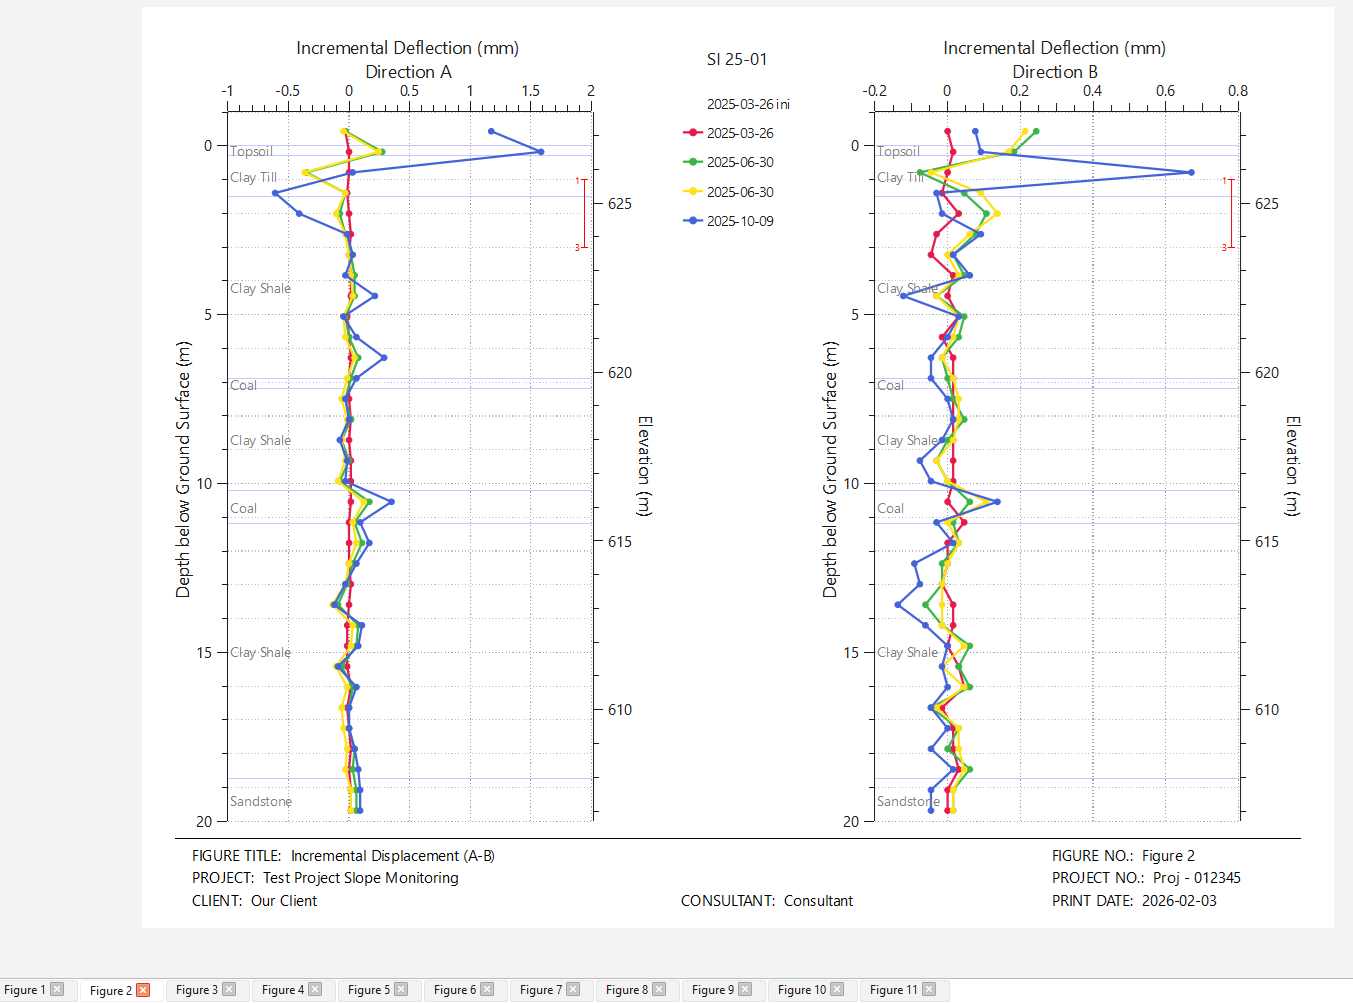
SlopeMonitor offers 2D site plans and 3D site views. 2D site plans show site boundaries, background imagery, borehole locations, and inclinometer azimuth orientations; 3D site views present boreholes with soil layers, ground surfaces, and spatial inclinometer displacement data views. 3D boreholes and slope inclinometer data can also be presented on Google Earth.

Project Management & Scheduling

SlopeMonitor includes a dedicated task and schedule function. This tool facilitates the planning of routine monitoring cycles, helping teams maintain data continuity and regulatory compliance.

Provide default OpenStreet Vector map, OpenStreet raster map, and ArcGIS hybrid map

Show user-provided maps by providing the map source and style address

Set default view, zoom level, borehole color, borehole label color, and map cache size

SI graphs including cumulative displacements, incremental displacements, absolute positions, relative displacement with time, shear strain with time

All the above graphs can be shown for a direction with a skew angle from A+ direction

Show groundwater level changes with time for both standpipes and vibrating wire piezometers

Show ground temperatures measured with thermistor strings

2D plan view

background images

Borehole locations

Slope inclinometer directions

Site boundaries 

3D boreholes with soil layers

Borehole numbers

vertical scale setup

Soil layer color setup

Ground surface construction with xyz data points

3D slope inclinometer reading curves

Show soil layers and SI data curves above or below ground surface

Google Earth integration

Show soil layers and slope inclinometer data in Google Earth

Click soil layers to show soil information

Click borehole symbols to find boreholes in SlopeMonitor

Show and edit SI readings

Show SI reading checksums

Restore original data anytime

Import GTilt data

Import RST, GEOKON, Encardio Rite data

Import other data through custom Python code

Save multiple figures

Specify figure numbers and figure titles

Export current figure, all shown figures, all figures of current site, and all figures of current project

Export figures to PDF files

SI bias shift error correction

SI rotation error correction

SI depth correction

Match current dataset with previous dataset

Graph limits settings

Graph curves spline fitting

Show data points

Show soil layers

Enter Vibrating wire piezometers data through equation

or directly enter groundwater level depth